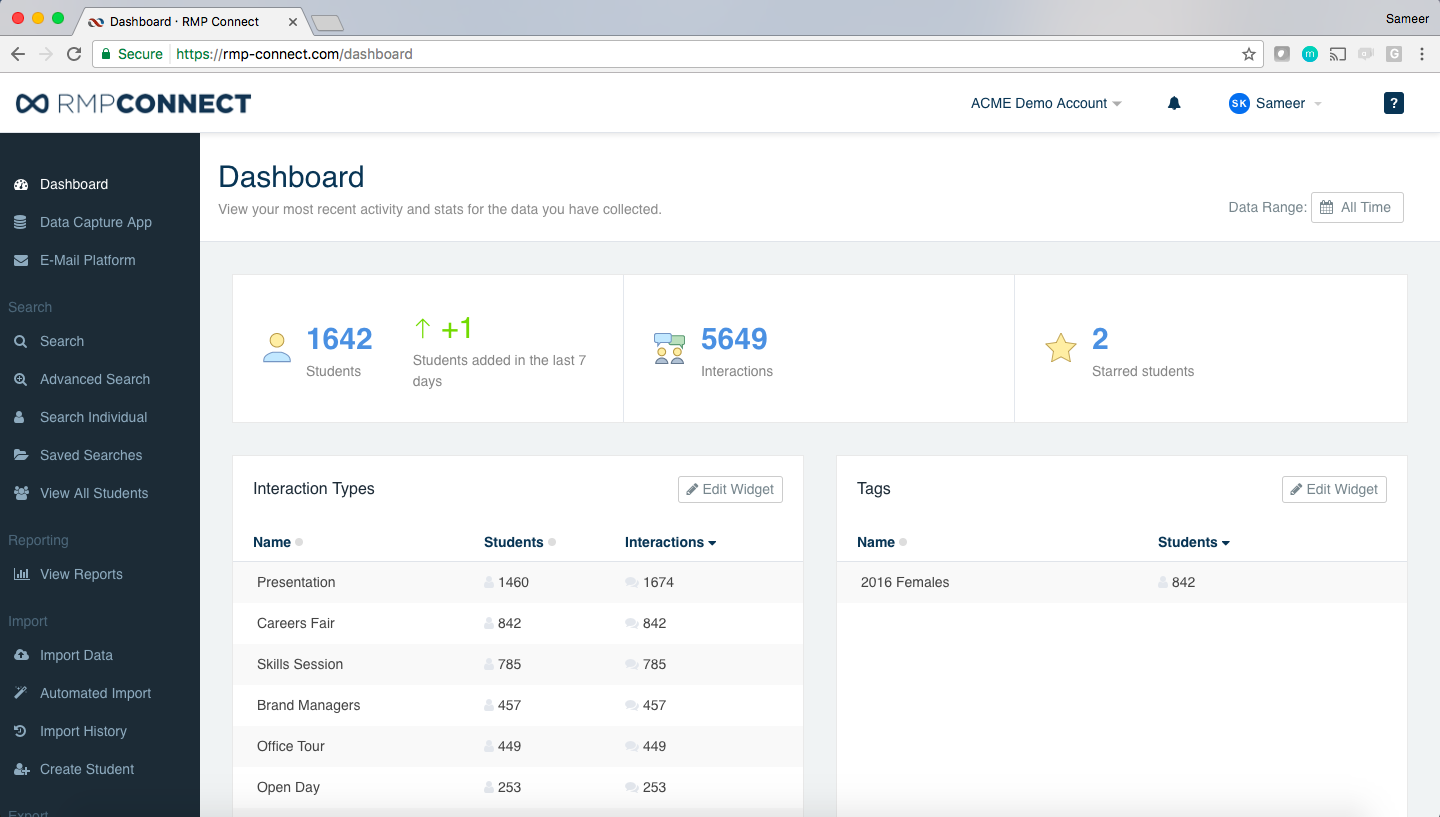
When you log into the RMP Connect dashboard, you will see three individual widgets. These show the following:
Total Statistics (top) - This shows the total number of students, and interactions had with those students as well as any increases in data over the course of the last 7 days. You can also see how many students have been "Starred", either through the Integrate Events (formerly Akkroo) App's Statistics Panel or manually through RMP Connect.
Interaction Types (left) - This shows your top 10 Interaction Types by default, although this can be customised from user to user in terms of what is shown and what isn't shown (more on that here), as well as the order in which the results are sorted. You can read more about Interaction Types by clicking here.
The number of Total Interactions should always be equal to or higher than Collected Students, if this is not the case please get in touch with your Account Manager.
Tags (right) - This shows your top 10 Tags by default, although this can be customised from user to user in terms of what is shown and what isn't shown (more on that here), as well as the order in which the results are sorted. You can read more about Tagging by clicking here.
The numbers within Total Statistics widgets, along with the listed Interaction Types and Tags are all clickable, and will bring up the relevant students when clicked on.

To find out more about customising your Interaction Types widget, or your Tags widget, visit the article here.
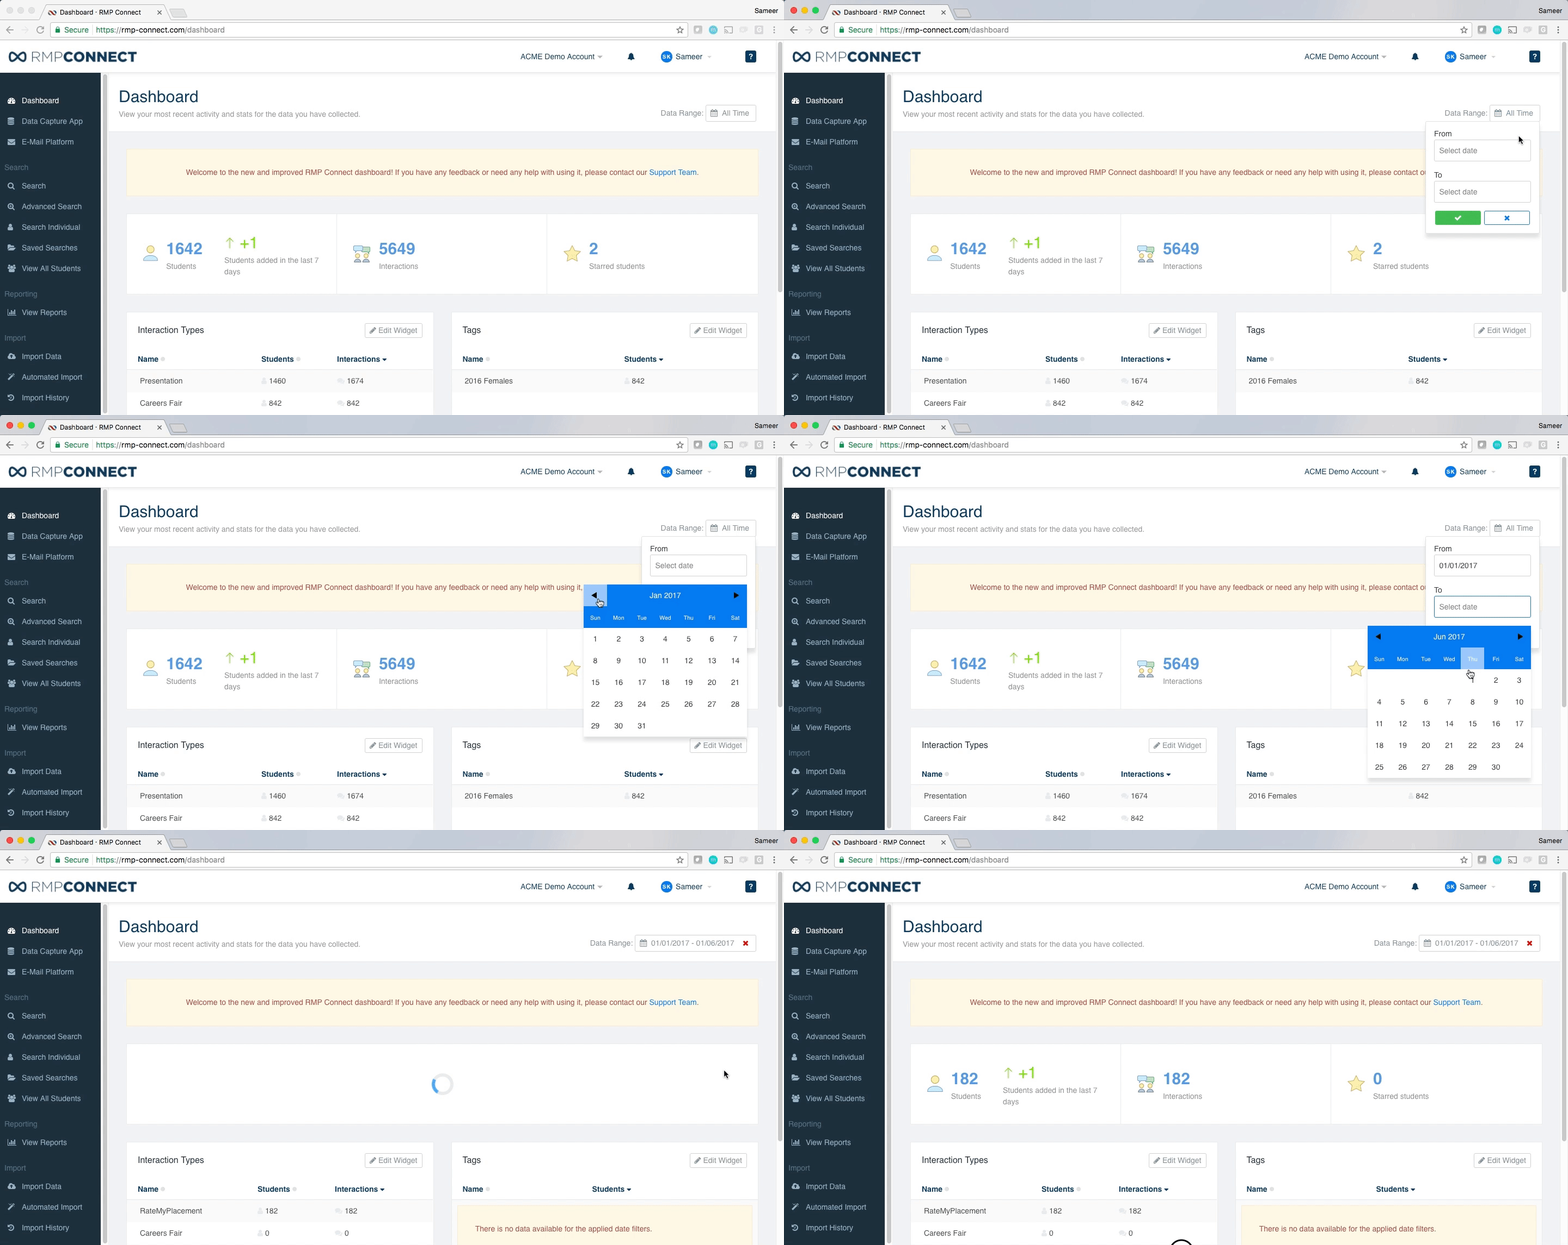
In the top right hand corner of the dashboard you will find a date picker - by default, the dashboard will show "all time" numbers. This can be amended by users by using the date picker in the top right hand corner, which is particularly useful for YOY analysis:
