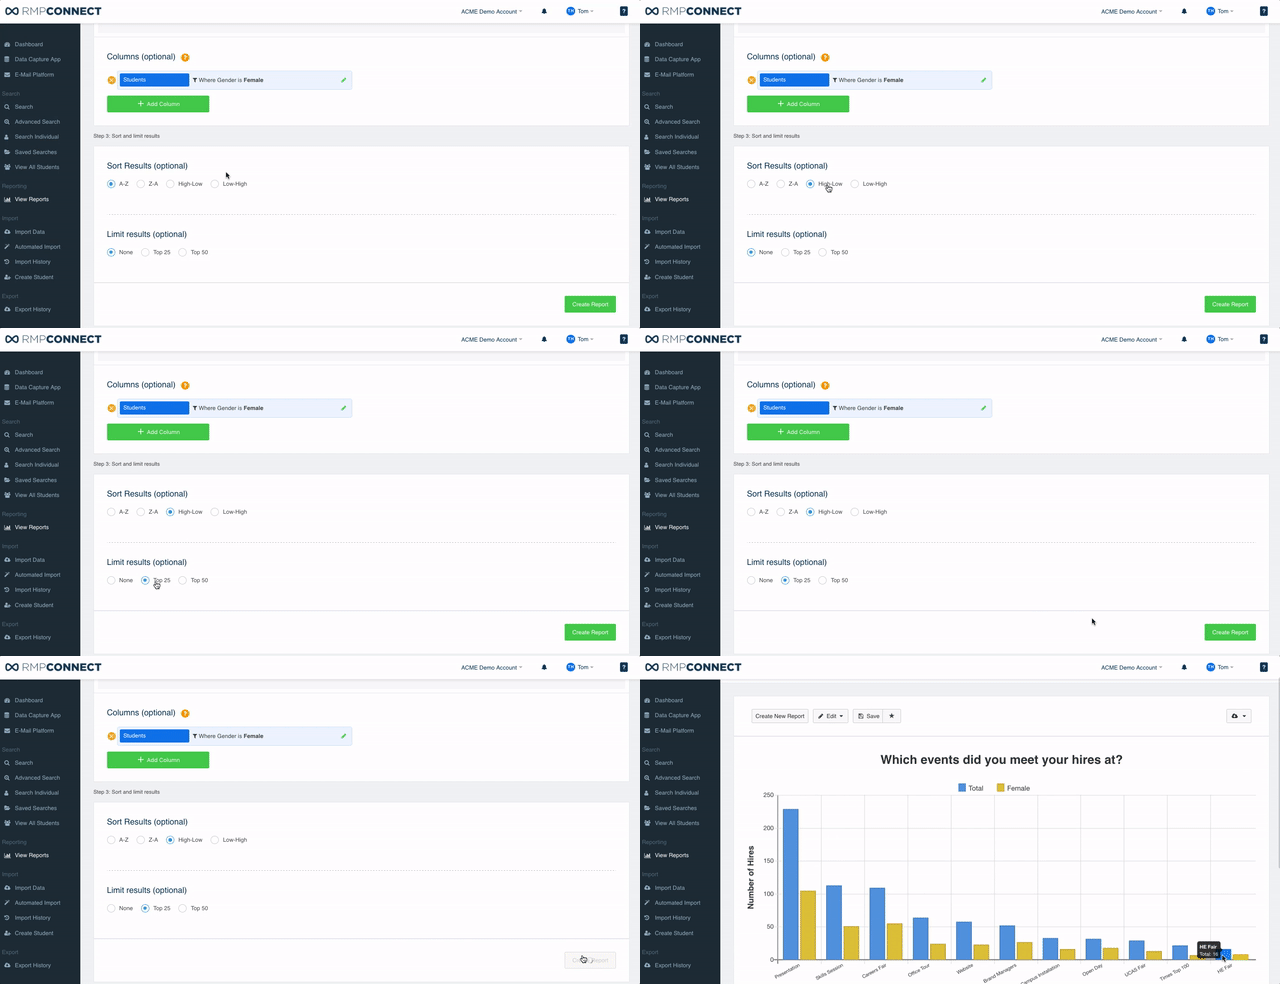
Student reports allow you to drill down in the demographics of your Talent Pool, breaking down characteristics such as gender, ethnicity, course and university from specific locations, events and interactions.
To create a new Student report, you need to do the following:
- Go to the RMP Connect Dashboard.
- Select "View Reports" on the left menu.
- Select the green "Create New Report" button (this will either be in the middle or the top left depending on if you have saved reports or not).
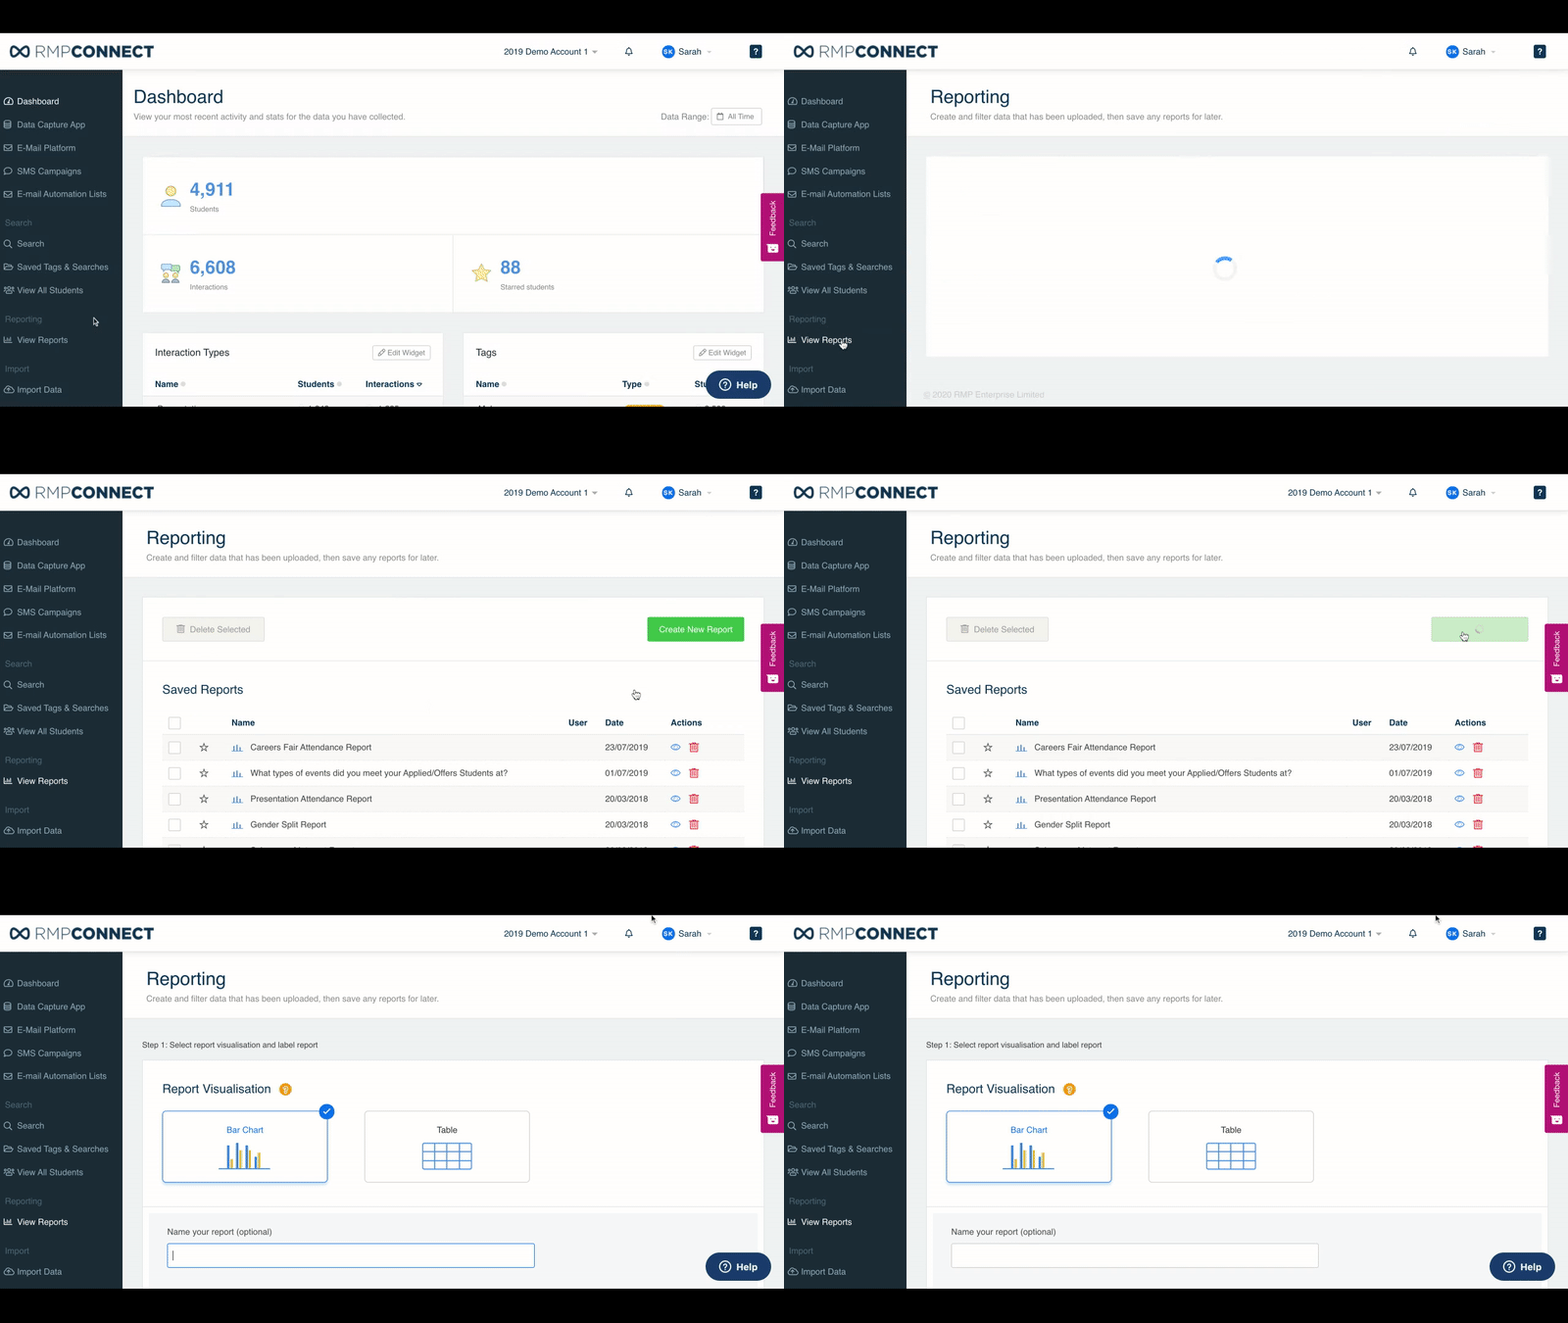
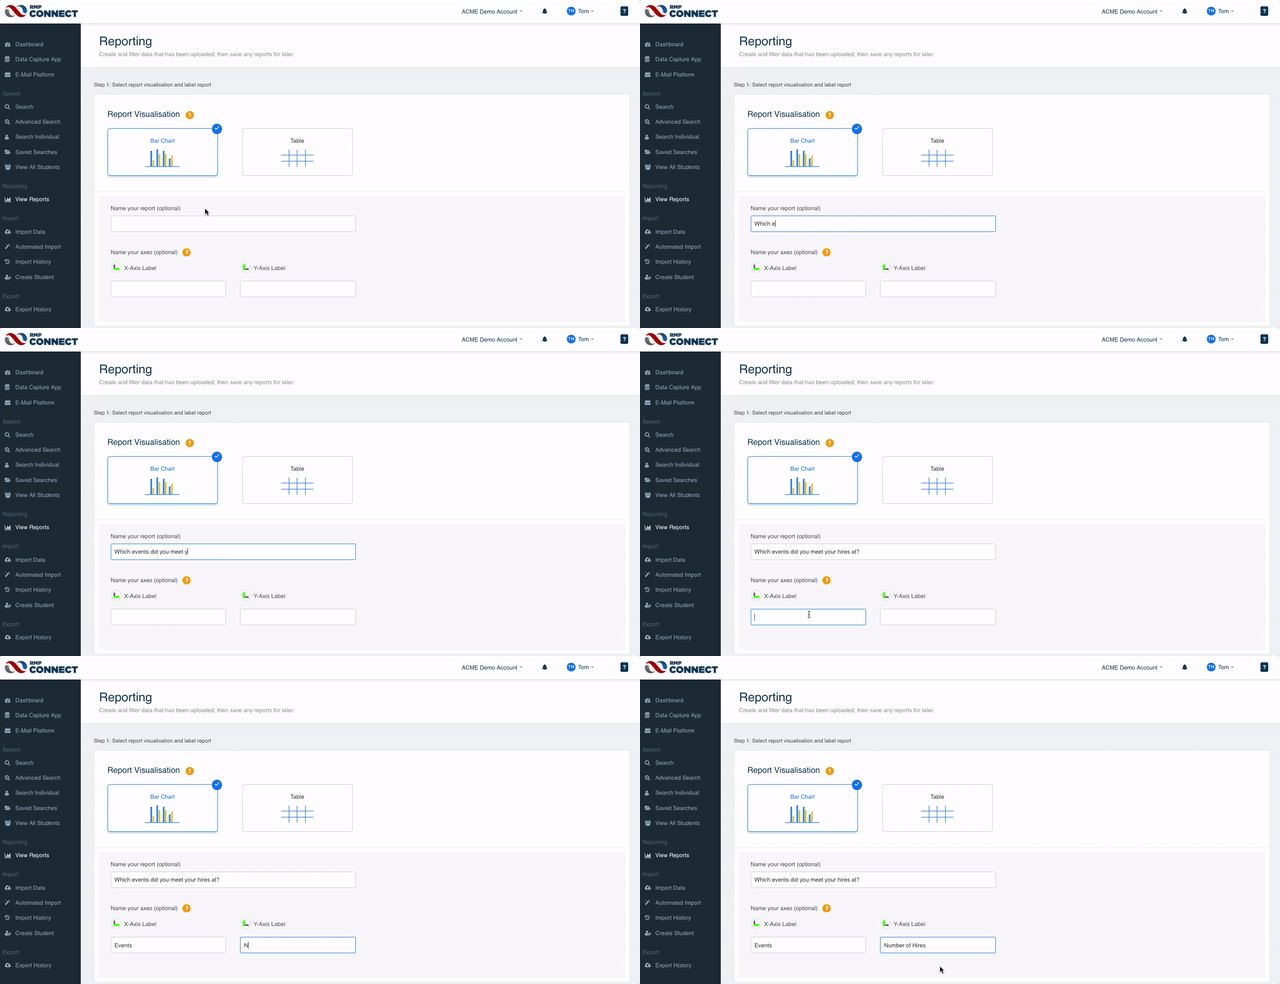
The first step is to select a bar chart report or a table. Bar chart reports do also include a table below, so you have both options.
You then have the option to name your report and label the axis, this is particularly useful if you are planning to export the report to a PDF, image or are intending to save it for later use.
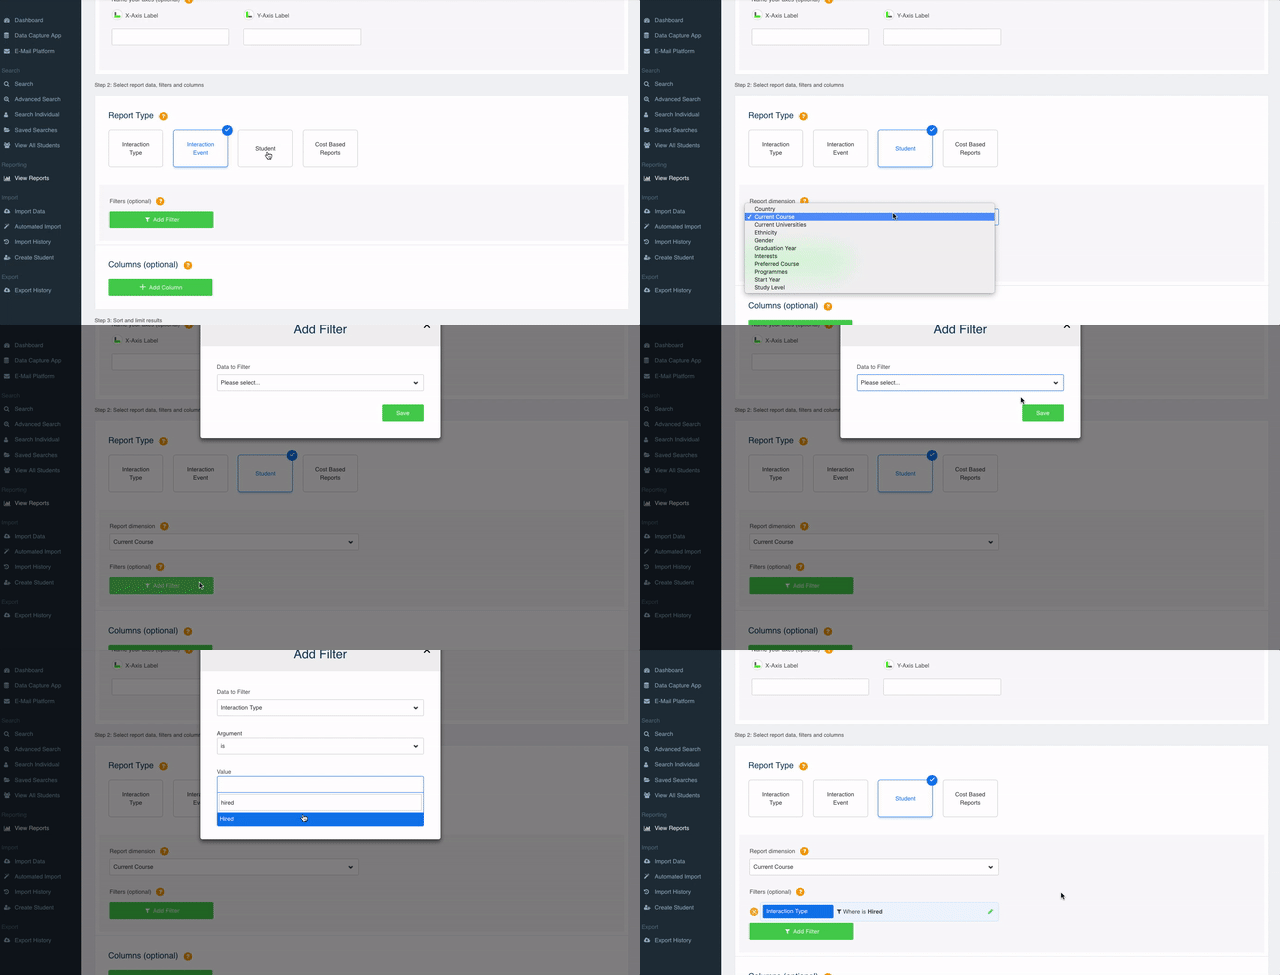
You then need to select the Students box from the four options.
When you select the above, it will bring up a dropdown of student demographic options for you to choose from. You can at this point run the report to see the breakdown of your entire Talent Pool. Alternatively, you can filter the data to look at the breakdown from a type of event, applicants, hires or over a certain time period.
To add a filter to your base set of data, you need to do the following:
- Select your demographic of choice.
- A green filter button will appear below, select "Add Filter".
- Select the type of data to filter from the dropdown e.g. Interaction Type.
- Type in the name of your interaction type, e.g. Hires.
- Hit the green "Save" button.
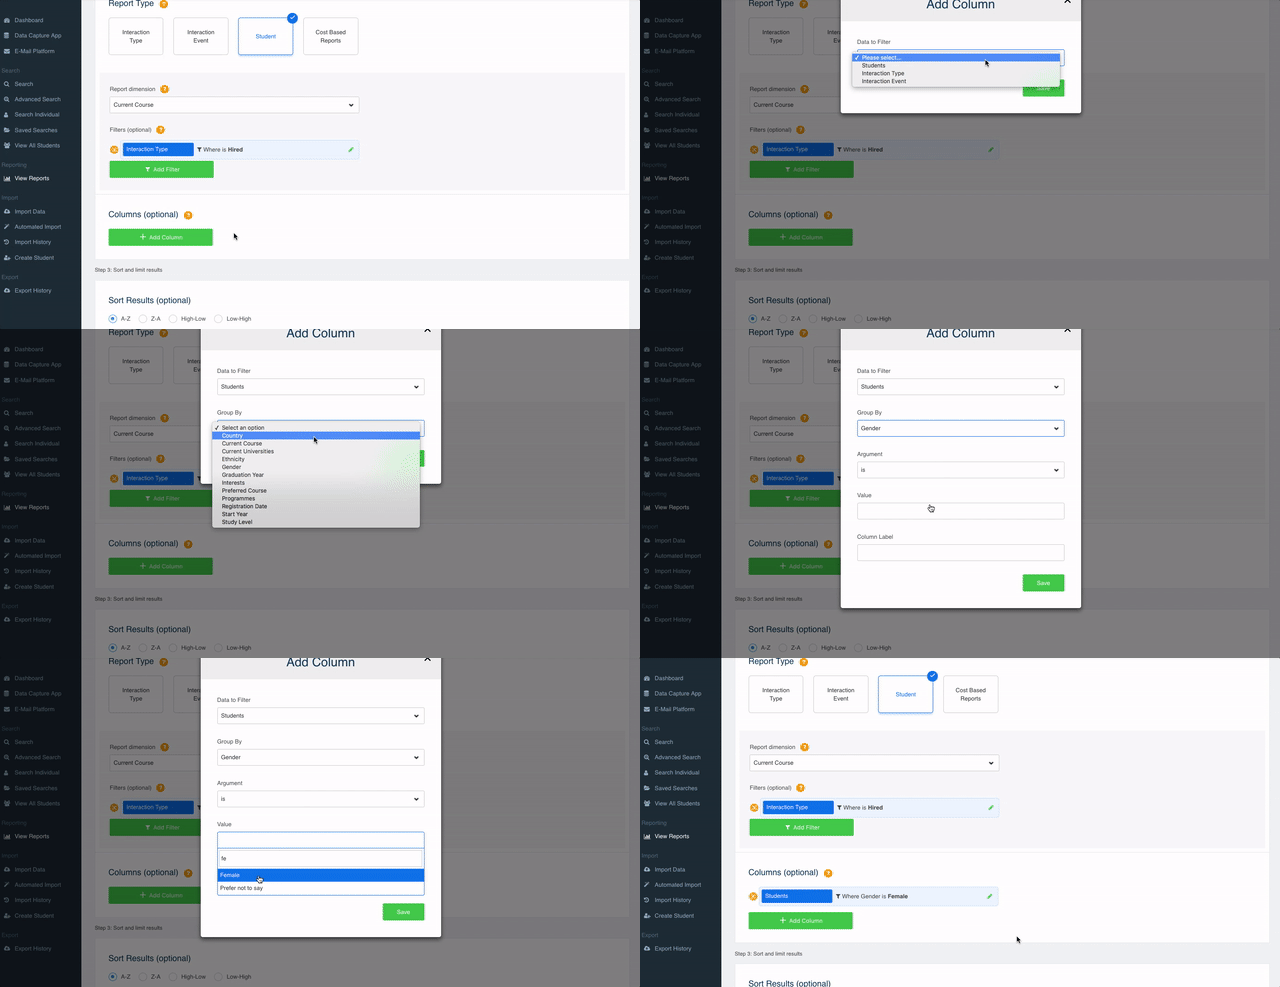
You also have the option to add additional columns to your report, such as looking at how many of the students that study those courses are female.
To add an additional column, you need to do the following:
- Select the green "Add Column" button.
- Select the type of data to filter from the dropdown e.g. Students.
- Select the demographic you wish you report on e.g. Gender.
- Add the value you wish to see, e.g. Female.
- Hit the green "Save" button.
The final step is to then sort and limit your results. You can choose to sort your results by A-Z, Z-A, High-Low and Low-High. You can also limit your results to the Top 25 or Top 50. These can be really useful when running reports that have the potential for a lot of results, such as a report on which courses your students study.
Once you been through the above steps, hit the green "Create Report" button to see your Interaction Type Report.
