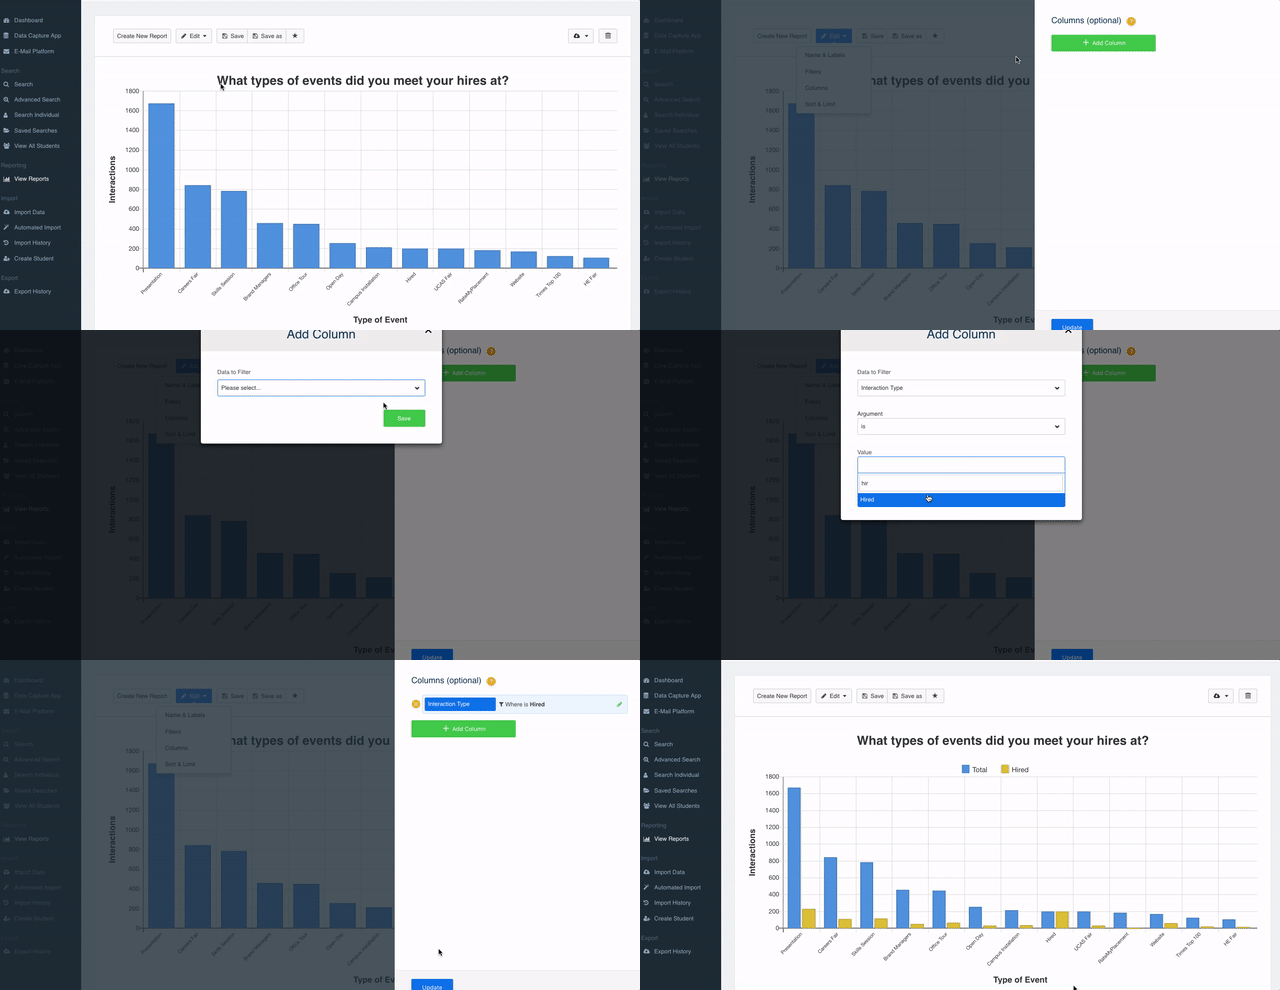
Once you have created a report, you have the ability to add another column in order to create a stacked bar chart. This can be really useful if you are looking to compare pre-registration vs attendance, interactions vs hires or demographic breakdowns.
To add additional filters to your report, you need to do the following:
- Once you have created a report, locate and select the "Edit" button on the top menu.
- Select "Columns" from the dropdown.
- Select the green "Add a Column" button.
- You then need to select your column, for example "Interaction Type" and then type in "Hired".
- Select the green "Save" button.
- Select the blue "Update" button.
